mixtree
Cyril Geismar
2026-06-25
mixtree.RmdIntroduction
The mixtree package provides a statistical framework for
comparing sets of trees (“forests”). The function
tree_test(), can apply various hypothesis testing
approaches to assess differences between forests. While currently
supporting transmission trees, future updates will expand functionality
to include phylogenetic trees and, graphs more generally.
Methods
The test compares the absolute frequencies of edges between forests. PERMANOVA compares the overall topological structure of trees between forests based on pairwise distances.
Both methods test the null hypothesis that the forests are drawn from the same generative process.
Input Requirements
Each input set must be a list of data frames. Every data frame represents a tree and must contain exactly two columns:
from: The parent node.to: The child node.
make_tree is a helper function that simulates a DAG with
the number of branches per node drawn from a Poisson distribution with
= R when stochastic = TRUE
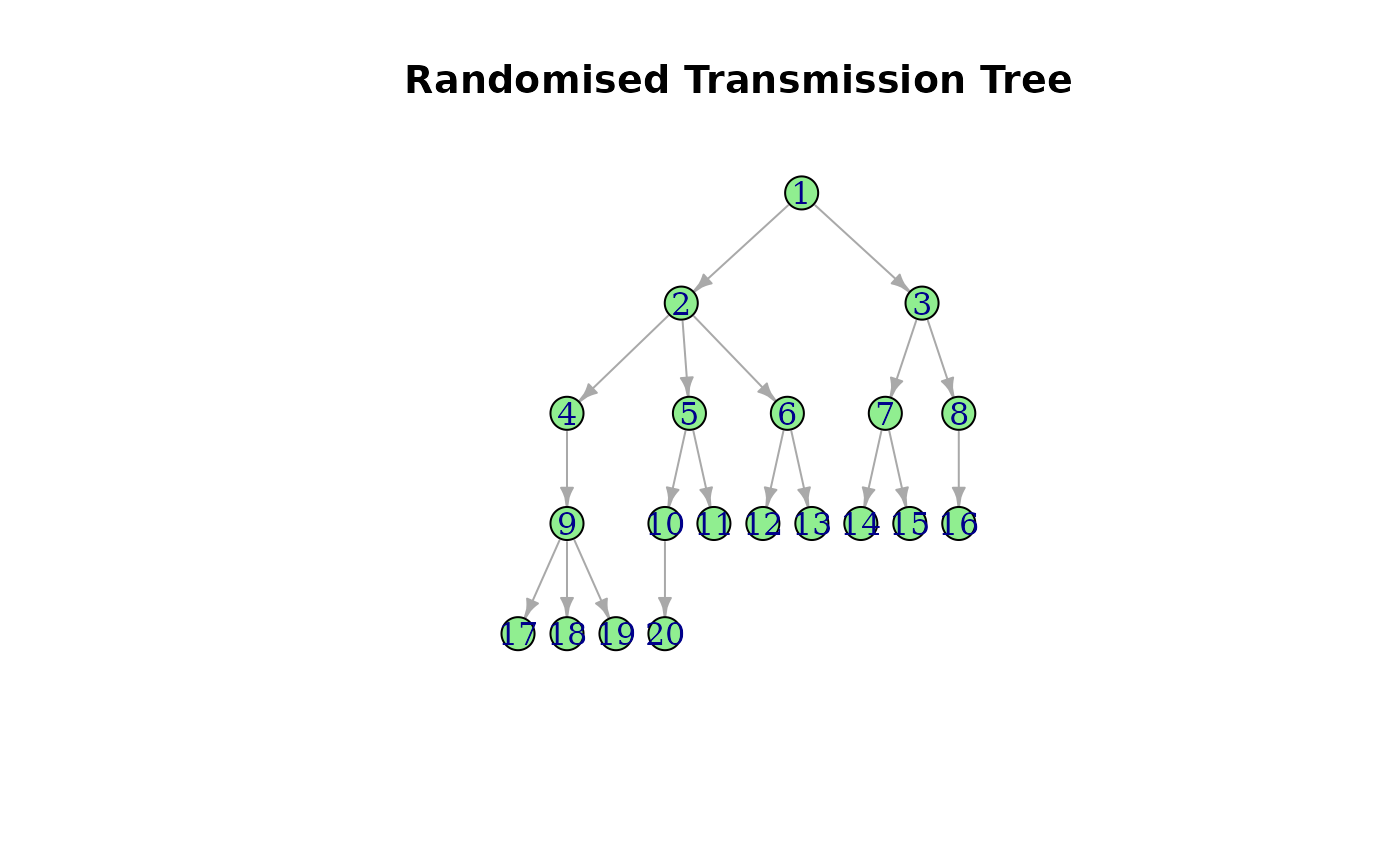
#> IGRAPH 1faf8ef D--- 20 19 --
#> + edges from 1faf8ef:
#>  [1]  1-> 2  1-> 3  2-> 4  2-> 5  2-> 6  3-> 7  3-> 8  4-> 9  5->10  5->11
#> [11]  6->12  6->13  7->14  7->15  8->16  9->17  9->18  9->19 10->20
Usage
The unified interface is provided by the tree_test()
function. Users can supply two or more sets of trees and select the
desired testing method via the method parameter.
PERMANOVA
set.seed(123)
# Generate 100 trees with R₀ = 2
chainA <- lapply(1:100, function(i){
  make_tree(20, R = 2, stochastic = TRUE) |>
    igraph::as_long_data_frame()
})

# Generate 100 trees with R₀ = 4
chainB <- lapply(1:100, function(i){
  make_tree(20, R = 4, stochastic = TRUE) |>
     igraph::as_long_data_frame()
})

tree_test(chainA, chainB, method = "permanova")
#> Permutation test for adonis under reduced model
#> Permutation: free
#> Number of permutations: 999
#>
#> (function (formula, data, permutations = 999, method = "bray", sqrt.dist = FALSE, add = FALSE, by = NULL, parallel = getOption("mc.cores"), na.action = na.fail, strata = NULL, ...)
#>           Df SumOfSqs      R2      F Pr(>F)
#> Model      1     8052 0.14429 33.388  0.001 ***
#> Residual 198    47750 0.85571
#> Total    199    55802 1.00000
#> ---
#> Signif. codes:  0 '***' 0.001 '**' 0.01 '*' 0.05 '.' 0.1 ' ' 1
The p-value is below the 5% significance level, we reject the null hypothesis of no difference.
Advanced Usage
The tree_test() function accepts additional parameters
to customise the testing process:
within_dist: A function to compute pairwise distances within a tree (used with PERMANOVA). Default ispatristic().between_dist: A function to compute the distance between two trees (used with PERMANOVA). Default iseuclidean().test_args: A list of extra arguments passed to the underlying test function (i.e.vegan::adonis2,stats::chisq.test, orstats::fisher.test).
Using Custom Distance Functions
The package supports custom distance functions, such as the MRCI
depth measure described in Kendall
et al.(2018). See also the vignette
from treespace.
library(treespace)
mrciDepth <- function(tree) {
 treespace::findMRCIs(as.matrix(tree))$mrciDepths
}
tree_test(chainA, chainB, within_dist = mrciDepth)
Note
Randomly shuffling node IDs will not affect the PERMANOVA test
results if the distance functions are invariant to node labelling
(e.g. patristic()). However, if a custom function depends
on the order or specific labels of nodes, then shuffling could influence
the results (e.g. treespace::findMRCIs).
chainA <- lapply(1:50, function(i) {
  make_tree(20, R = 2, stochastic = TRUE)
})
chainB <- lapply(1:50, function(i) {
  df <- mixtree:::shuffle_graph_ids(chainA[[i]]) |>
    igraph::as_long_data_frame()
  subset(df, select = c("from", "to"))
})
chainA <- lapply(chainA, igraph::as_long_data_frame)

tree_test(chainA, chainB, method = "permanova")
#> Permutation test for adonis under reduced model
#> Permutation: free
#> Number of permutations: 999
#>
#> (function (formula, data, permutations = 999, method = "bray", sqrt.dist = FALSE, add = FALSE, by = NULL, parallel = getOption("mc.cores"), na.action = na.fail, strata = NULL, ...)
#>          Df SumOfSqs R2  F Pr(>F)
#> Model     1        0  0  0      1
#> Residual 98    32796  1
#> Total    99    32796  1

# In contrast, the Chi-Square test will reject the null as it compare edge frequencies
tree_test(chainA, chainB, method = "chisq")
#>
#>  Pearson's Chi-squared test
#>
#> data:  count data
#> X-squared = 849.55, df = 193, p-value < 2.2e-16